Pallid Cuckoo
Heteroscenes pallidus
ABR description
The following is extracted from the Annual Bird Report for the twelve months to June 2017.
Common, breeding summer migrant
Records tend to come from drier areas of the COG AoI in spring and summer. May possibly be heading for extinction locally.
General: 65 records down from 125 records last year from 32 grids down on 40 grids last year. Abundance is down 63% on last year and down 86% on the 30YA. The reporting rate is down 57% on last year and down 87% on the 30YA, now at its lowest level ever. Reported predominantly in spring 65% and summer 29%. Earliest record 1/18 Aug Carwoola GrQ16 (BuM1); latest, 1/4 Feb Campbell Park (SmA1). 1 breeding record: di/14 Oct Michelago GrL25 (LaS2).
GBS: 16 records down from 19 last year, from 4 sites down from 6 last year. Abundance is down 14% on last year and down 65% on the 30YA. The reporting rate is down 5% on last year and down 61% on the 30YA. First record: 1/3wk Aug Carwoola (BuM1); latest, 1/1wk Feb Oxley (WaJ3).

Abundance
Abundance is the average number of birds of that species per survey. Where the species was observed (presence recorded) but the number of birds seen was not recorded, this is treated as a count of zero.
Abundance by year
This chart shows the abundance of Pallid Cuckoo between 1982 and 2017. 
Abundance by month
This chart shows the monthly abundance of Pallid Cuckoo. The blue lines show the abundance for the twelve months to June 2017 and the bars show the average abundance for the period 1982 to 2017. 
Abundance by season
This chart shows the seasonal abundance of Pallid Cuckoo. The blue lines show the seasonal abundance for the twelve months to June 2017 and the bars show the average seasonal abundance for the period 1982 to 2017. 
Abundance data
| Month | Season | ||||||||||||||||||
|---|---|---|---|---|---|---|---|---|---|---|---|---|---|---|---|---|---|---|---|
| Period | Jul | Aug | Sep | Oct | Nov | Dec | Jan | Feb | Mar | Apr | May | Jun | Winter | Spring | Summer | Autumn | All | ||
| All years | |||||||||||||||||||
| All | 0.0 | 0.0 | 0.1 | 0.1 | 0.1 | 0.0 | 0.0 | 0.0 | 0.0 | 0.0 | 0.0 | 0.0 | 0.0 | 0.1 | 0.0 | 0.0 | 0.0 | ||
| Previous years | |||||||||||||||||||
| All previous years | 0.0 | 0.0 | 0.1 | 0.1 | 0.1 | 0.1 | 0.0 | 0.0 | 0.0 | 0.0 | 0.0 | 0.0 | 0.0 | 0.1 | 0.0 | 0.0 | 0.0 | ||
| Previous 30 years | 0.0 | 0.0 | 0.1 | 0.1 | 0.1 | 0.1 | 0.0 | 0.0 | 0.0 | 0.0 | 0.0 | 0.0 | 0.0 | 0.1 | 0.0 | 0.0 | 0.0 | ||
| Previous 20 years | 0.0 | 0.0 | 0.1 | 0.1 | 0.1 | 0.0 | 0.0 | 0.0 | 0.0 | 0.0 | 0.0 | 0.0 | 0.0 | 0.1 | 0.0 | 0.0 | 0.0 | ||
| 10 year groups | |||||||||||||||||||
| [2007,2017) | 0.0 | 0.0 | 0.1 | 0.1 | 0.1 | 0.0 | 0.0 | 0.0 | 0.0 | 0.0 | 0.0 | 0.0 | 0.0 | 0.1 | 0.0 | 0.0 | 0.0 | ||
| [1997,2007) | 0.0 | 0.0 | 0.2 | 0.2 | 0.1 | 0.1 | 0.0 | 0.0 | 0.0 | 0.0 | 0.0 | 0.0 | 0.0 | 0.2 | 0.0 | 0.0 | 0.1 | ||
| [1987,1997) | 0.0 | 0.1 | 0.1 | 0.2 | 0.1 | 0.1 | 0.0 | 0.0 | 0.0 | 0.0 | 0.0 | 0.0 | 0.0 | 0.1 | 0.0 | 0.0 | 0.1 | ||
| 5 year groups | |||||||||||||||||||
| [2012,2017) | 0.0 | 0.0 | 0.0 | 0.1 | 0.0 | 0.0 | 0.0 | 0.0 | 0.0 | 0.0 | 0.0 | 0.0 | 0.0 | 0.0 | 0.0 | 0.0 | 0.0 | ||
| [2007,2012) | 0.0 | 0.1 | 0.2 | 0.1 | 0.1 | 0.1 | 0.0 | 0.0 | 0.0 | 0.0 | 0.0 | 0.0 | 0.0 | 0.1 | 0.0 | 0.0 | 0.1 | ||
| [2002,2007) | 0.0 | 0.0 | 0.1 | 0.1 | 0.1 | 0.1 | 0.0 | 0.0 | 0.0 | 0.0 | 0.0 | 0.0 | 0.0 | 0.1 | 0.0 | 0.0 | 0.0 | ||
| [1997,2002) | 0.0 | 0.0 | 0.2 | 0.3 | 0.2 | 0.1 | 0.0 | 0.0 | 0.0 | 0.0 | 0.0 | 0.0 | 0.0 | 0.2 | 0.1 | 0.0 | 0.1 | ||
| [1992,1997) | 0.0 | 0.0 | 0.1 | 0.1 | 0.1 | 0.1 | 0.0 | 0.0 | 0.0 | 0.0 | 0.0 | 0.0 | 0.0 | 0.1 | 0.0 | 0.0 | 0.0 | ||
| [1987,1992) | 0.0 | 0.1 | 0.1 | 0.2 | 0.1 | 0.1 | 0.0 | 0.0 | 0.0 | 0.0 | 0.0 | 0.0 | 0.0 | 0.2 | 0.0 | 0.0 | 0.1 | ||
| Year | |||||||||||||||||||
| 2017 | 0.0 | 0.0 | 0.0 | 0.0 | 0.0 | 0.0 | 0.0 | 0.0 | 0.0 | 0.0 | 0.0 | 0.0 | 0.0 | 0.0 | 0.0 | 0.0 | 0.0 | ||
| 2016 | 0.0 | 0.0 | 0.0 | 0.1 | 0.0 | 0.0 | 0.0 | 0.0 | 0.0 | 0.0 | 0.0 | 0.0 | 0.0 | 0.0 | 0.0 | 0.0 | 0.0 | ||
| 2015 | 0.0 | 0.0 | 0.0 | 0.0 | 0.0 | 0.0 | 0.0 | 0.0 | 0.0 | 0.0 | 0.0 | 0.0 | 0.0 | 0.0 | 0.0 | 0.0 | 0.0 | ||
| 2014 | 0.0 | 0.0 | 0.0 | 0.0 | 0.0 | 0.0 | 0.0 | 0.0 | 0.0 | 0.0 | 0.0 | 0.0 | 0.0 | 0.0 | 0.0 | 0.0 | 0.0 | ||
| 2013 | 0.0 | 0.0 | 0.0 | 0.1 | 0.0 | 0.0 | 0.0 | 0.0 | 0.0 | 0.0 | 0.0 | 0.0 | 0.0 | 0.0 | 0.0 | 0.0 | 0.0 | ||
| 2012 | 0.0 | 0.0 | 0.0 | 0.0 | 0.0 | 0.0 | 0.0 | 0.0 | 0.0 | 0.0 | 0.0 | 0.0 | 0.0 | 0.0 | 0.0 | 0.0 | 0.0 | ||
| 2011 | 0.0 | 0.0 | 0.1 | 0.1 | 0.1 | 0.0 | 0.0 | 0.0 | 0.0 | 0.0 | 0.0 | 0.0 | 0.0 | 0.1 | 0.0 | 0.0 | 0.0 | ||
| 2010 | 0.0 | 0.1 | 0.2 | 0.2 | 0.1 | 0.1 | 0.0 | 0.0 | 0.0 | 0.0 | 0.0 | 0.0 | 0.0 | 0.2 | 0.0 | 0.0 | 0.1 | ||
| 2009 | 0.0 | 0.0 | 0.1 | 0.2 | 0.1 | 0.1 | 0.0 | 0.0 | 0.0 | 0.0 | 0.0 | 0.0 | 0.0 | 0.1 | 0.1 | 0.0 | 0.1 | ||
| 2008 | 0.0 | 0.1 | 0.3 | 0.1 | 0.1 | 0.1 | 0.0 | 0.0 | 0.0 | 0.0 | 0.0 | 0.0 | 0.0 | 0.2 | 0.1 | 0.0 | 0.1 | ||
| 2007 | 0.0 | 0.0 | 0.1 | 0.1 | 0.1 | 0.0 | 0.0 | 0.0 | 0.0 | 0.0 | 0.0 | 0.0 | 0.0 | 0.1 | 0.0 | 0.0 | 0.0 | ||
| 2006 | 0.0 | 0.0 | 0.1 | 0.1 | 0.1 | 0.0 | 0.0 | 0.0 | 0.0 | 0.0 | 0.0 | 0.0 | 0.0 | 0.1 | 0.0 | 0.0 | 0.0 | ||
| 2005 | 0.0 | 0.0 | 0.1 | 0.1 | 0.1 | 0.1 | 0.0 | 0.0 | 0.0 | 0.0 | 0.0 | 0.0 | 0.0 | 0.1 | 0.1 | 0.0 | 0.0 | ||
| 2004 | 0.0 | 0.0 | 0.1 | 0.0 | 0.0 | 0.0 | 0.0 | 0.0 | 0.0 | 0.0 | 0.0 | 0.0 | 0.0 | 0.1 | 0.0 | 0.0 | 0.0 | ||
| 2003 | 0.0 | 0.0 | 0.1 | 0.1 | 0.1 | 0.1 | 0.0 | 0.0 | 0.0 | 0.0 | 0.0 | 0.0 | 0.0 | 0.1 | 0.0 | 0.0 | 0.0 | ||
| 2002 | 0.0 | 0.0 | 0.3 | 0.1 | 0.1 | 0.1 | 0.0 | 0.0 | 0.0 | 0.0 | 0.0 | 0.0 | 0.0 | 0.2 | 0.0 | 0.0 | 0.1 | ||
| 2001 | 0.0 | 0.0 | 0.2 | 0.3 | 0.2 | 0.2 | 0.0 | 0.0 | 0.0 | 0.0 | 0.0 | 0.0 | 0.0 | 0.2 | 0.1 | 0.0 | 0.1 | ||
| 2000 | 0.0 | 0.0 | 0.3 | 0.4 | 0.3 | 0.0 | 0.0 | 0.0 | 0.0 | 0.0 | 0.0 | 0.0 | 0.0 | 0.3 | 0.0 | 0.0 | 0.1 | ||
| 1999 | 0.0 | 0.0 | 0.1 | 0.1 | 0.1 | 0.1 | 0.0 | 0.0 | 0.0 | 0.0 | 0.0 | 0.0 | 0.0 | 0.1 | 0.0 | 0.0 | 0.0 | ||
| 1998 | 0.0 | 0.0 | 0.1 | 0.0 | 0.2 | 0.0 | 0.0 | 0.0 | 0.0 | 0.0 | 0.0 | 0.0 | 0.0 | 0.1 | 0.0 | 0.0 | 0.1 | ||
| 1997 | 0.0 | 0.0 | 0.2 | 0.1 | 0.1 | 0.0 | 0.0 | 0.0 | 0.0 | 0.0 | 0.0 | 0.0 | 0.0 | 0.1 | 0.0 | 0.0 | 0.1 | ||
| 1996 | 0.0 | 0.1 | 0.5 | 0.1 | 0.2 | 0.1 | 0.0 | 0.0 | 0.0 | 0.0 | 0.0 | 0.0 | 0.0 | 0.2 | 0.0 | 0.0 | 0.1 | ||
| 1995 | 0.0 | 0.0 | 0.0 | 0.1 | 0.1 | 0.1 | 0.0 | 0.0 | 0.0 | 0.0 | 0.0 | 0.0 | 0.0 | 0.1 | 0.0 | 0.0 | 0.0 | ||
| 1994 | 0.0 | 0.0 | 0.0 | 0.1 | 0.1 | 0.0 | 0.0 | 0.0 | 0.0 | 0.0 | 0.0 | 0.0 | 0.0 | 0.1 | 0.0 | 0.0 | 0.0 | ||
| 1993 | 0.0 | 0.0 | 0.0 | 0.1 | 0.0 | 0.0 | 0.1 | 0.0 | 0.0 | 0.0 | 0.0 | 0.0 | 0.0 | 0.1 | 0.0 | 0.0 | 0.0 | ||
| 1992 | 0.0 | 0.0 | 0.1 | 0.2 | 0.2 | 0.1 | 0.0 | 0.0 | 0.0 | 0.0 | 0.0 | 0.0 | 0.0 | 0.1 | 0.0 | 0.0 | 0.1 | ||
| 1991 | 0.0 | 0.0 | 0.1 | 0.1 | 0.2 | 0.0 | 0.0 | 0.0 | 0.0 | 0.0 | 0.0 | 0.0 | 0.0 | 0.1 | 0.0 | 0.0 | 0.0 | ||
| 1990 | 0.0 | 0.0 | 0.1 | 0.1 | 0.1 | 0.1 | 0.1 | 0.0 | 0.0 | 0.0 | 0.0 | 0.0 | 0.0 | 0.1 | 0.1 | 0.0 | 0.0 | ||
| 1989 | 0.0 | 0.1 | 0.2 | 0.3 | 0.2 | 0.1 | 0.1 | 0.0 | 0.0 | 0.0 | 0.0 | 0.0 | 0.0 | 0.2 | 0.1 | 0.0 | 0.1 | ||
| 1988 | 0.0 | 0.1 | 0.2 | 0.2 | 0.2 | 0.1 | 0.0 | 0.0 | 0.0 | 0.0 | 0.0 | 0.0 | 0.0 | 0.2 | 0.0 | 0.0 | 0.1 | ||
| 1987 | 0.0 | 0.0 | 0.1 | 0.1 | 0.1 | 0.0 | 0.0 | 0.0 | 0.0 | 0.0 | 0.0 | 0.0 | 0.0 | 0.1 | 0.0 | 0.0 | 0.0 | ||
| 1986 | 0.0 | 0.1 | 0.1 | 0.3 | 0.3 | 0.3 | 0.0 | 0.0 | 0.0 | 0.0 | 0.0 | 0.0 | 0.0 | 0.2 | 0.1 | 0.0 | 0.1 | ||
| 1985 | 0.0 | 0.0 | 0.0 | 0.1 | 0.1 | 0.0 | 0.0 | 0.1 | 0.1 | 0.0 | 0.0 | 0.0 | 0.0 | 0.1 | 0.0 | 0.0 | 0.0 | ||
| 1984 | 0.0 | 0.0 | 0.0 | 0.1 | 0.0 | 0.0 | 0.2 | 0.0 | 0.0 | 0.0 | 0.0 | 0.0 | 0.0 | 0.0 | 0.1 | 0.0 | 0.0 | ||
| 1983 | 0.0 | 0.0 | 0.0 | 0.0 | 0.0 | 0.0 | 0.0 | 0.0 | 0.0 | - | 0.0 | 0.0 | 0.0 | 0.0 | 0.0 | 0.0 | 0.0 | ||
| 1982 | - | 0.0 | - | 0.0 | 0.0 | 0.0 | - | 0.0 | - | 0.0 | - | 0.0 | 0.0 | 0.0 | 0.0 | 0.0 | 0.0 | ||
Reporting rates
Reporting rate is the proportion of all surveys in which the species was present.
Reporting rate by year
This chart shows the reporting rate of Pallid Cuckoo each year between 1982 and 2017. 
Reporting rate by month
This chart shows the reporting rate by month of Pallid Cuckoo. The blue lines show the reporting rate for the twelve months to June 2017 and the bars show the average reporting rate for the period 1982 to 2017. 
Reporting rate by season
This chart shows the seasonal reporting rate of Pallid Cuckoo. The blue lines show the seasonal reporting rate for the twelve months to June 2017 and the bars show the average seasonal reporting rate for the period 1982 to 2017. 
Reporting rate data
| Month | Season | ||||||||||||||||||
|---|---|---|---|---|---|---|---|---|---|---|---|---|---|---|---|---|---|---|---|
| Period | Jul | Aug | Sep | Oct | Nov | Dec | Jan | Feb | Mar | Apr | May | Jun | Winter | Spring | Summer | Autumn | All | ||
| All years | |||||||||||||||||||
| All | 0.1 | 2.1 | 7.4 | 8.5 | 7.3 | 4.5 | 1.3 | 0.6 | 0.3 | 0.1 | 0.0 | 0.1 | 0.7 | 7.8 | 2.2 | 0.2 | 3.0 | ||
| Previous years | |||||||||||||||||||
| All previous years | 0.1 | 2.4 | 8.3 | 9.5 | 8.2 | 5.0 | 1.5 | 0.7 | 0.3 | 0.1 | 0.1 | 0.1 | 0.8 | 8.8 | 2.5 | 0.2 | 3.5 | ||
| Previous 30 years | 0.1 | 2.4 | 8.4 | 9.4 | 8.1 | 5.0 | 1.5 | 0.7 | 0.3 | 0.1 | 0.1 | 0.1 | 0.8 | 8.8 | 2.5 | 0.2 | 3.5 | ||
| Previous 20 years | 0.1 | 1.5 | 7.7 | 8.4 | 7.3 | 4.7 | 1.1 | 0.6 | 0.2 | 0.1 | 0.0 | 0.1 | 0.5 | 7.9 | 2.2 | 0.1 | 3.1 | ||
| 10 year groups | |||||||||||||||||||
| [2007,2017) | 0.0 | 1.3 | 4.6 | 6.8 | 4.4 | 2.7 | 0.8 | 0.5 | 0.2 | 0.1 | 0.1 | 0.1 | 0.5 | 5.6 | 1.4 | 0.1 | 2.2 | ||
| [1997,2007) | 0.1 | 1.8 | 14.0 | 14.0 | 13.1 | 8.4 | 1.9 | 0.9 | 0.3 | 0.1 | 0.0 | 0.2 | 0.6 | 13.7 | 4.5 | 0.2 | 5.2 | ||
| [1987,1997) | 0.2 | 5.1 | 11.7 | 15.7 | 10.9 | 6.9 | 3.7 | 1.1 | 0.9 | 0.4 | 0.1 | 0.1 | 1.9 | 12.8 | 4.0 | 0.5 | 5.3 | ||
| 5 year groups | |||||||||||||||||||
| [2012,2017) | 0.1 | 0.4 | 1.5 | 4.4 | 2.1 | 1.6 | 0.4 | 0.3 | 0.2 | 0.1 | 0.0 | 0.1 | 0.2 | 2.9 | 0.7 | 0.1 | 1.1 | ||
| [2007,2012) | 0.0 | 4.8 | 11.7 | 10.7 | 10.5 | 5.2 | 2.2 | 1.2 | 0.2 | 0.1 | 0.3 | 0.1 | 1.2 | 10.9 | 3.3 | 0.2 | 4.8 | ||
| [2002,2007) | 0.0 | 1.1 | 12.0 | 10.7 | 10.2 | 6.9 | 1.9 | 0.6 | 0.4 | 0.0 | 0.0 | 0.0 | 0.3 | 11.0 | 3.9 | 0.2 | 4.2 | ||
| [1997,2002) | 0.2 | 2.7 | 16.4 | 18.8 | 16.5 | 10.4 | 1.9 | 1.2 | 0.2 | 0.1 | 0.0 | 0.4 | 1.0 | 17.2 | 5.2 | 0.1 | 6.5 | ||
| [1992,1997) | 0.0 | 2.3 | 8.7 | 9.6 | 7.9 | 5.0 | 2.0 | 0.4 | 1.4 | 0.2 | 0.0 | 0.0 | 0.9 | 8.7 | 2.6 | 0.6 | 3.5 | ||
| [1987,1992) | 0.3 | 6.5 | 13.2 | 19.0 | 12.4 | 7.7 | 4.6 | 1.4 | 0.7 | 0.5 | 0.1 | 0.1 | 2.5 | 14.9 | 4.6 | 0.4 | 6.2 | ||
| Year | |||||||||||||||||||
| 2017 | 0.0 | 0.4 | 0.7 | 1.4 | 1.4 | 1.1 | 0.4 | 0.1 | 0.0 | 0.0 | 0.0 | 0.0 | 0.1 | 1.2 | 0.5 | 0.0 | 0.5 | ||
| 2016 | 0.0 | 0.4 | 1.5 | 5.1 | 2.8 | 1.6 | 0.2 | 0.2 | 0.0 | 0.0 | 0.0 | 0.0 | 0.1 | 3.4 | 0.6 | 0.0 | 1.1 | ||
| 2015 | 0.0 | 0.2 | 1.0 | 3.8 | 1.5 | 1.0 | 0.7 | 0.3 | 0.4 | 0.1 | 0.0 | 0.0 | 0.1 | 2.3 | 0.6 | 0.2 | 0.9 | ||
| 2014 | 0.0 | 0.8 | 0.8 | 2.4 | 1.5 | 1.1 | 0.0 | 1.0 | 0.0 | 0.0 | 0.0 | 0.0 | 0.3 | 1.7 | 0.5 | 0.0 | 0.7 | ||
| 2013 | 0.0 | 0.0 | 1.9 | 4.6 | 2.3 | 1.7 | 0.8 | 0.0 | 0.2 | 0.0 | 0.0 | 0.0 | 0.0 | 3.2 | 1.0 | 0.1 | 1.3 | ||
| 2012 | 0.4 | 0.4 | 2.4 | 5.5 | 2.2 | 2.7 | 0.7 | 0.5 | 0.3 | 0.6 | 0.0 | 0.6 | 0.5 | 3.9 | 1.3 | 0.3 | 1.9 | ||
| 2011 | 0.0 | 2.4 | 8.5 | 9.3 | 5.5 | 4.8 | 1.2 | 0.5 | 0.3 | 0.3 | 0.0 | 0.6 | 0.8 | 8.4 | 2.4 | 0.2 | 3.2 | ||
| 2010 | 0.0 | 7.9 | 13.1 | 15.8 | 12.9 | 5.1 | 1.9 | 1.2 | 0.4 | 0.0 | 2.0 | 0.0 | 1.9 | 14.4 | 3.4 | 0.5 | 6.5 | ||
| 2009 | 0.0 | 3.1 | 10.5 | 12.7 | 12.1 | 5.8 | 2.7 | 2.5 | 0.0 | 0.0 | 0.0 | 0.0 | 0.7 | 12.0 | 3.9 | 0.0 | 5.7 | ||
| 2008 | 0.0 | 9.6 | 17.2 | 8.6 | 9.4 | 9.5 | 3.2 | 0.9 | 0.5 | 0.0 | 0.0 | 0.0 | 2.3 | 11.0 | 5.7 | 0.2 | 5.8 | ||
| 2007 | 0.0 | 0.9 | 8.7 | 7.2 | 11.5 | 2.0 | 3.1 | 1.7 | 0.0 | 0.4 | 0.0 | 0.0 | 0.2 | 8.4 | 2.4 | 0.2 | 3.4 | ||
| 2006 | 0.0 | 0.0 | 6.2 | 10.0 | 8.9 | 2.8 | 3.9 | 0.7 | 0.3 | 0.0 | 0.0 | 0.0 | 0.0 | 8.7 | 2.6 | 0.2 | 3.3 | ||
| 2005 | 0.0 | 0.9 | 7.1 | 12.2 | 9.0 | 7.6 | 0.7 | 2.2 | 0.0 | 0.0 | 0.0 | 0.0 | 0.2 | 9.1 | 4.5 | 0.0 | 3.5 | ||
| 2004 | 0.0 | 2.0 | 11.5 | 2.9 | 5.2 | 4.6 | 1.8 | 1.0 | 0.5 | 0.0 | 0.0 | 0.0 | 0.5 | 6.9 | 2.9 | 0.2 | 2.7 | ||
| 2003 | 0.0 | 2.2 | 11.9 | 10.9 | 13.8 | 8.9 | 2.2 | 0.0 | 0.4 | 0.0 | 0.0 | 0.0 | 0.7 | 12.2 | 4.3 | 0.2 | 4.9 | ||
| 2002 | 0.0 | 0.0 | 25.9 | 16.3 | 12.5 | 8.6 | 0.6 | 0.0 | 0.9 | 0.0 | 0.0 | 0.0 | 0.0 | 18.1 | 4.6 | 0.4 | 6.6 | ||
| 2001 | 0.0 | 1.8 | 15.1 | 25.6 | 21.0 | 21.0 | 3.5 | 2.1 | 0.3 | 0.0 | 0.0 | 0.0 | 0.5 | 19.8 | 10.3 | 0.1 | 8.1 | ||
| 2000 | 0.0 | 3.9 | 24.7 | 26.9 | 18.1 | 4.3 | 1.7 | 1.4 | 0.4 | 0.0 | 0.0 | 1.6 | 1.9 | 23.3 | 2.7 | 0.2 | 7.5 | ||
| 1999 | 0.0 | 4.1 | 9.2 | 10.7 | 13.0 | 10.0 | 0.7 | 0.7 | 0.0 | 0.0 | 0.0 | 0.0 | 1.2 | 10.9 | 4.1 | 0.0 | 4.1 | ||
| 1998 | 2.7 | 1.9 | 14.6 | 1.1 | 15.9 | 4.7 | 1.5 | 0.0 | 0.0 | 0.0 | 0.0 | 0.0 | 1.2 | 11.3 | 2.6 | 0.0 | 5.1 | ||
| 1997 | 0.0 | 0.0 | 17.3 | 11.8 | 12.0 | 5.8 | 0.0 | 0.0 | 0.0 | 0.9 | 0.0 | 0.0 | 0.0 | 13.9 | 2.8 | 0.5 | 5.3 | ||
| 1996 | 0.0 | 6.4 | 29.3 | 7.0 | 11.1 | 6.1 | 1.9 | 0.0 | 0.0 | 0.0 | 0.0 | 0.0 | 2.4 | 14.1 | 2.8 | 0.0 | 5.3 | ||
| 1995 | 0.0 | 0.8 | 3.9 | 7.9 | 6.4 | 4.6 | 1.8 | 1.6 | 4.1 | 0.8 | 0.0 | 0.0 | 0.3 | 6.4 | 2.7 | 1.7 | 2.9 | ||
| 1994 | 0.0 | 1.3 | 2.9 | 10.5 | 5.1 | 2.2 | 0.0 | 0.0 | 0.0 | 0.0 | 0.0 | 0.0 | 0.5 | 6.2 | 0.6 | 0.0 | 2.0 | ||
| 1993 | 0.0 | 1.3 | 0.0 | 6.7 | 4.5 | 2.2 | 6.1 | 0.0 | 1.2 | 0.0 | 0.0 | 0.0 | 0.5 | 3.9 | 3.1 | 0.5 | 1.9 | ||
| 1992 | 0.0 | 1.9 | 7.1 | 17.0 | 13.9 | 7.9 | 1.7 | 0.0 | 1.4 | 0.0 | 0.0 | 0.0 | 0.6 | 12.7 | 3.7 | 0.5 | 5.0 | ||
| 1991 | 0.0 | 4.3 | 7.0 | 9.7 | 9.3 | 1.4 | 1.8 | 0.0 | 0.0 | 0.0 | 0.0 | 0.0 | 1.5 | 8.7 | 1.1 | 0.0 | 3.4 | ||
| 1990 | 0.6 | 1.6 | 6.5 | 11.2 | 13.1 | 5.6 | 8.3 | 2.8 | 1.1 | 0.0 | 0.0 | 0.0 | 1.0 | 10.4 | 5.6 | 0.4 | 4.1 | ||
| 1989 | 0.5 | 11.2 | 16.6 | 26.5 | 17.7 | 13.5 | 5.9 | 1.5 | 1.1 | 1.0 | 0.0 | 0.6 | 4.7 | 20.7 | 7.4 | 0.8 | 9.0 | ||
| 1988 | 0.0 | 7.1 | 18.5 | 22.3 | 17.6 | 8.2 | 3.5 | 2.3 | 0.0 | 1.1 | 0.5 | 0.0 | 2.7 | 19.5 | 4.7 | 0.5 | 7.3 | ||
| 1987 | 0.0 | 0.0 | 10.9 | 14.8 | 5.4 | 3.8 | 4.1 | 0.4 | 1.0 | 0.0 | 0.0 | 0.0 | 0.0 | 9.9 | 2.6 | 0.3 | 4.3 | ||
| 1986 | 0.0 | 5.3 | 11.3 | 36.1 | 29.8 | 17.6 | 4.3 | 0.0 | 0.0 | 0.0 | 0.0 | 0.0 | 2.0 | 24.3 | 7.5 | 0.0 | 9.6 | ||
| 1985 | 0.0 | 0.0 | 1.9 | 8.1 | 5.3 | 1.7 | 0.0 | 5.9 | 9.1 | 0.0 | 0.0 | 0.0 | 0.0 | 5.6 | 2.4 | 2.5 | 3.4 | ||
| 1984 | 0.0 | 0.0 | 0.0 | 8.3 | 0.0 | 0.0 | 17.2 | 0.0 | 0.0 | 0.0 | 0.0 | 0.0 | 0.0 | 4.8 | 6.8 | 0.0 | 2.5 | ||
| 1983 | 0.0 | 0.0 | 0.0 | 0.0 | 0.0 | 0.0 | 0.0 | 0.0 | 0.0 | - | 0.0 | 0.0 | 0.0 | 0.0 | 0.0 | 0.0 | 0.0 | ||
| 1982 | - | 0.0 | - | 0.0 | 0.0 | 0.0 | - | 0.0 | - | 0.0 | - | 0.0 | 0.0 | 0.0 | 0.0 | 0.0 | 0.0 | ||
Breeding data
Breeding records by month
Number of breeding records by breeding code and month, 2017 and all years| Breeding code | Jul | Aug | Sep | Oct | Nov | Dec | Jan | Feb | Mar | Apr | May | Jun |
|---|---|---|---|---|---|---|---|---|---|---|---|---|
| 2017 | ||||||||||||
| Breeding (BLA code) | 0 | 0 | 0 | 0 | 0 | 0 | 0 | 0 | 0 | 0 | 0 | 0 |
| Carrying Food | 0 | 0 | 0 | 0 | 0 | 0 | 0 | 0 | 0 | 0 | 0 | 0 |
| Copulating | 0 | 0 | 0 | 0 | 0 | 0 | 0 | 0 | 0 | 0 | 0 | 0 |
| Display | 0 | 0 | 0 | 1 | 0 | 0 | 0 | 0 | 0 | 0 | 0 | 0 |
| Dependent young | 0 | 0 | 0 | 0 | 0 | 0 | 0 | 0 | 0 | 0 | 0 | 0 |
| Faecal sac | 0 | 0 | 0 | 0 | 0 | 0 | 0 | 0 | 0 | 0 | 0 | 0 |
| Inspecting hollow | 0 | 0 | 0 | 0 | 0 | 0 | 0 | 0 | 0 | 0 | 0 | 0 |
| Nest building | 0 | 0 | 0 | 0 | 0 | 0 | 0 | 0 | 0 | 0 | 0 | 0 |
| Nest with eggs | 0 | 0 | 0 | 0 | 0 | 0 | 0 | 0 | 0 | 0 | 0 | 0 |
| Nest with young | 0 | 0 | 0 | 0 | 0 | 0 | 0 | 0 | 0 | 0 | 0 | 0 |
| On/leaving nest | 0 | 0 | 0 | 0 | 0 | 0 | 0 | 0 | 0 | 0 | 0 | 0 |
| All years | ||||||||||||
| Breeding (BLA code) | 0 | 0 | 0 | 0 | 0 | 1 | 0 | 0 | 0 | 0 | 0 | 0 |
| Carrying Food | 0 | 0 | 0 | 0 | 0 | 0 | 0 | 0 | 0 | 0 | 0 | 0 |
| Copulating | 0 | 0 | 3 | 0 | 0 | 0 | 0 | 0 | 0 | 0 | 0 | 0 |
| Display | 0 | 0 | 3 | 6 | 0 | 0 | 0 | 0 | 0 | 0 | 0 | 0 |
| Dependent young | 0 | 0 | 0 | 2 | 2 | 11 | 19 | 3 | 3 | 1 | 0 | 0 |
| Faecal sac | 0 | 0 | 0 | 0 | 0 | 0 | 0 | 0 | 0 | 0 | 0 | 0 |
| Inspecting hollow | 0 | 0 | 0 | 0 | 0 | 0 | 0 | 0 | 0 | 0 | 0 | 0 |
| Nest building | 0 | 0 | 0 | 0 | 0 | 1 | 0 | 0 | 0 | 0 | 0 | 0 |
| Nest with eggs | 0 | 0 | 0 | 0 | 0 | 0 | 0 | 0 | 0 | 0 | 0 | 0 |
| Nest with young | 0 | 0 | 0 | 0 | 0 | 0 | 1 | 0 | 0 | 0 | 0 | 0 |
| On/leaving nest | 0 | 0 | 0 | 0 | 0 | 0 | 0 | 0 | 0 | 0 | 0 | 0 |
Breeding records by year
Average number of breeding records per period by breeding code| Period | Breeding (BLA code) | Carrying Food | Copulating | Display | Dependent young | Faecal sac | Inspecting hollow | Nest building | Nest with eggs | Nest with young | On/leaving nest |
|---|---|---|---|---|---|---|---|---|---|---|---|
| All years | |||||||||||
| All | 0.0 | 0.0 | 0.1 | 0.2 | 1.1 | 0.0 | 0.0 | 0.0 | 0.0 | 0.0 | 0.0 |
| Previous years | |||||||||||
| All previous years | 0.0 | 0.0 | 0.1 | 0.2 | 1.2 | 0.0 | 0.0 | 0.0 | 0.0 | 0.0 | 0.0 |
| Previous 30 years | 0.0 | 0.0 | 0.1 | 0.3 | 1.3 | 0.0 | 0.0 | 0.0 | 0.0 | 0.0 | 0.0 |
| Previous 20 years | 0.0 | 0.0 | 0.1 | 0.4 | 0.8 | 0.0 | 0.0 | 0.0 | 0.0 | 0.0 | 0.0 |
| 10 year groups | |||||||||||
| [2007,2017) | 0.0 | 0.0 | 0.3 | 0.8 | 1.0 | 0.0 | 0.0 | 0.0 | 0.0 | 0.0 | 0.0 |
| [1997,2007) | 0.1 | 0.0 | 0.0 | 0.0 | 0.6 | 0.0 | 0.0 | 0.0 | 0.0 | 0.0 | 0.0 |
| [1987,1997) | 0.0 | 0.0 | 0.0 | 0.0 | 2.4 | 0.0 | 0.0 | 0.1 | 0.0 | 0.1 | 0.0 |
| 5 year groups | |||||||||||
| [2012,2017) | 0.0 | 0.0 | 0.2 | 0.8 | 0.2 | 0.0 | 0.0 | 0.0 | 0.0 | 0.0 | 0.0 |
| [2007,2012) | 0.0 | 0.0 | 0.4 | 0.8 | 1.8 | 0.0 | 0.0 | 0.0 | 0.0 | 0.0 | 0.0 |
| [2002,2007) | 0.0 | 0.0 | 0.0 | 0.0 | 0.0 | 0.0 | 0.0 | 0.0 | 0.0 | 0.0 | 0.0 |
| [1997,2002) | 0.2 | 0.0 | 0.0 | 0.0 | 1.2 | 0.0 | 0.0 | 0.0 | 0.0 | 0.0 | 0.0 |
| [1992,1997) | 0.0 | 0.0 | 0.0 | 0.0 | 2.0 | 0.0 | 0.0 | 0.0 | 0.0 | 0.0 | 0.0 |
| [1987,1992) | 0.0 | 0.0 | 0.0 | 0.0 | 2.8 | 0.0 | 0.0 | 0.2 | 0.0 | 0.2 | 0.0 |
| Year | |||||||||||
| 2017 | 0.0 | 0.0 | 0.0 | 1.0 | 0.0 | 0.0 | 0.0 | 0.0 | 0.0 | 0.0 | 0.0 |
| 2016 | 0.0 | 0.0 | 0.0 | 2.0 | 0.0 | 0.0 | 0.0 | 0.0 | 0.0 | 0.0 | 0.0 |
| 2015 | 0.0 | 0.0 | 0.0 | 0.0 | 1.0 | 0.0 | 0.0 | 0.0 | 0.0 | 0.0 | 0.0 |
| 2014 | 0.0 | 0.0 | 1.0 | 0.0 | 0.0 | 0.0 | 0.0 | 0.0 | 0.0 | 0.0 | 0.0 |
| 2013 | 0.0 | 0.0 | 0.0 | 2.0 | 0.0 | 0.0 | 0.0 | 0.0 | 0.0 | 0.0 | 0.0 |
| 2012 | 0.0 | 0.0 | 0.0 | 0.0 | 0.0 | 0.0 | 0.0 | 0.0 | 0.0 | 0.0 | 0.0 |
| 2011 | 0.0 | 0.0 | 0.0 | 2.0 | 1.0 | 0.0 | 0.0 | 0.0 | 0.0 | 0.0 | 0.0 |
| 2010 | 0.0 | 0.0 | 1.0 | 1.0 | 0.0 | 0.0 | 0.0 | 0.0 | 0.0 | 0.0 | 0.0 |
| 2009 | 0.0 | 0.0 | 0.0 | 0.0 | 0.0 | 0.0 | 0.0 | 0.0 | 0.0 | 0.0 | 0.0 |
| 2008 | 0.0 | 0.0 | 1.0 | 0.0 | 0.0 | 0.0 | 0.0 | 0.0 | 0.0 | 0.0 | 0.0 |
| 2007 | 0.0 | 0.0 | 0.0 | 1.0 | 8.0 | 0.0 | 0.0 | 0.0 | 0.0 | 0.0 | 0.0 |
| 2006 | 0.0 | 0.0 | 0.0 | 0.0 | 0.0 | 0.0 | 0.0 | 0.0 | 0.0 | 0.0 | 0.0 |
| 2005 | 0.0 | 0.0 | 0.0 | 0.0 | 0.0 | 0.0 | 0.0 | 0.0 | 0.0 | 0.0 | 0.0 |
| 2004 | 0.0 | 0.0 | 0.0 | 0.0 | 0.0 | 0.0 | 0.0 | 0.0 | 0.0 | 0.0 | 0.0 |
| 2003 | 0.0 | 0.0 | 0.0 | 0.0 | 0.0 | 0.0 | 0.0 | 0.0 | 0.0 | 0.0 | 0.0 |
| 2002 | 0.0 | 0.0 | 0.0 | 0.0 | 0.0 | 0.0 | 0.0 | 0.0 | 0.0 | 0.0 | 0.0 |
| 2001 | 0.0 | 0.0 | 0.0 | 0.0 | 2.0 | 0.0 | 0.0 | 0.0 | 0.0 | 0.0 | 0.0 |
| 2000 | 0.0 | 0.0 | 0.0 | 0.0 | 1.0 | 0.0 | 0.0 | 0.0 | 0.0 | 0.0 | 0.0 |
| 1999 | 1.0 | 0.0 | 0.0 | 0.0 | 1.0 | 0.0 | 0.0 | 0.0 | 0.0 | 0.0 | 0.0 |
| 1998 | 0.0 | 0.0 | 0.0 | 0.0 | 1.0 | 0.0 | 0.0 | 0.0 | 0.0 | 0.0 | 0.0 |
| 1997 | 0.0 | 0.0 | 0.0 | 0.0 | 1.0 | 0.0 | 0.0 | 0.0 | 0.0 | 0.0 | 0.0 |
| 1996 | 0.0 | 0.0 | 0.0 | 0.0 | 4.0 | 0.0 | 0.0 | 0.0 | 0.0 | 0.0 | 0.0 |
| 1995 | 0.0 | 0.0 | 0.0 | 0.0 | 4.0 | 0.0 | 0.0 | 0.0 | 0.0 | 0.0 | 0.0 |
| 1994 | 0.0 | 0.0 | 0.0 | 0.0 | 0.0 | 0.0 | 0.0 | 0.0 | 0.0 | 0.0 | 0.0 |
| 1993 | 0.0 | 0.0 | 0.0 | 0.0 | 0.0 | 0.0 | 0.0 | 0.0 | 0.0 | 0.0 | 0.0 |
| 1992 | 0.0 | 0.0 | 0.0 | 0.0 | 2.0 | 0.0 | 0.0 | 0.0 | 0.0 | 0.0 | 0.0 |
| 1991 | 0.0 | 0.0 | 0.0 | 0.0 | 0.0 | 0.0 | 0.0 | 0.0 | 0.0 | 0.0 | 0.0 |
| 1990 | 0.0 | 0.0 | 0.0 | 0.0 | 3.0 | 0.0 | 0.0 | 0.0 | 0.0 | 0.0 | 0.0 |
| 1989 | 0.0 | 0.0 | 0.0 | 0.0 | 3.0 | 0.0 | 0.0 | 0.0 | 0.0 | 0.0 | 0.0 |
| 1988 | 0.0 | 0.0 | 0.0 | 0.0 | 5.0 | 0.0 | 0.0 | 1.0 | 0.0 | 1.0 | 0.0 |
| 1987 | 0.0 | 0.0 | 0.0 | 0.0 | 3.0 | 0.0 | 0.0 | 0.0 | 0.0 | 0.0 | 0.0 |
| 1986 | 0.0 | 0.0 | 0.0 | 0.0 | 0.0 | 0.0 | 0.0 | 0.0 | 0.0 | 0.0 | 0.0 |
| 1985 | 0.0 | 0.0 | 0.0 | 0.0 | 0.0 | 0.0 | 0.0 | 0.0 | 0.0 | 0.0 | 0.0 |
| 1984 | 0.0 | 0.0 | 0.0 | 0.0 | 1.0 | 0.0 | 0.0 | 0.0 | 0.0 | 0.0 | 0.0 |
| 1983 | 0.0 | 0.0 | 0.0 | 0.0 | 0.0 | 0.0 | 0.0 | 0.0 | 0.0 | 0.0 | 0.0 |
| 1982 | 0.0 | 0.0 | 0.0 | 0.0 | 0.0 | 0.0 | 0.0 | 0.0 | 0.0 | 0.0 | 0.0 |
Distribution map
Distribution - 2017
This map shows the observed distribution of the Pallid Cuckoo for 2017.
The red circles are the grid cells where Pallid Cuckoo have been reported.
The transparency of the red circles indicate how many surveys sheets were submitted for that grid cell; the darker the red the more reliable the data. Of the 315 grid cells with reports, 83 had only one sheet; an example is grid number K5.
The size of the circle represents the reporting rate. The maximum reporting rate for Pallid Cuckoo was 100.0% (eg grid number K5) and the minimum was 0.1% (eg grid number L14). 
Distribution - all years
This map shows the observed distribution of the Pallid Cuckoo for all years.
The red circles are the grid cells where Pallid Cuckoo have been reported.
The transparency of the red circles indicate how many surveys sheets were submitted for that grid cell; the darker the red the more reliable the data. Of the 703 grid cells with reports, 55 had only one sheet; an example is grid number A12.
The size of the circle represents the reporting rate. The maximum reporting rate for Pallid Cuckoo was 50.0% (eg grid number K30) and the minimum was 0.1% (eg grid number S13). 
Breeding map
Breeding - 2017
This map shows the breeding distribution of the Pallid Cuckoo for 2017.
The red circles are the grid cells where breeding activity for Pallid Cuckoo have been reported.
The size of the circle represents the number of reports. 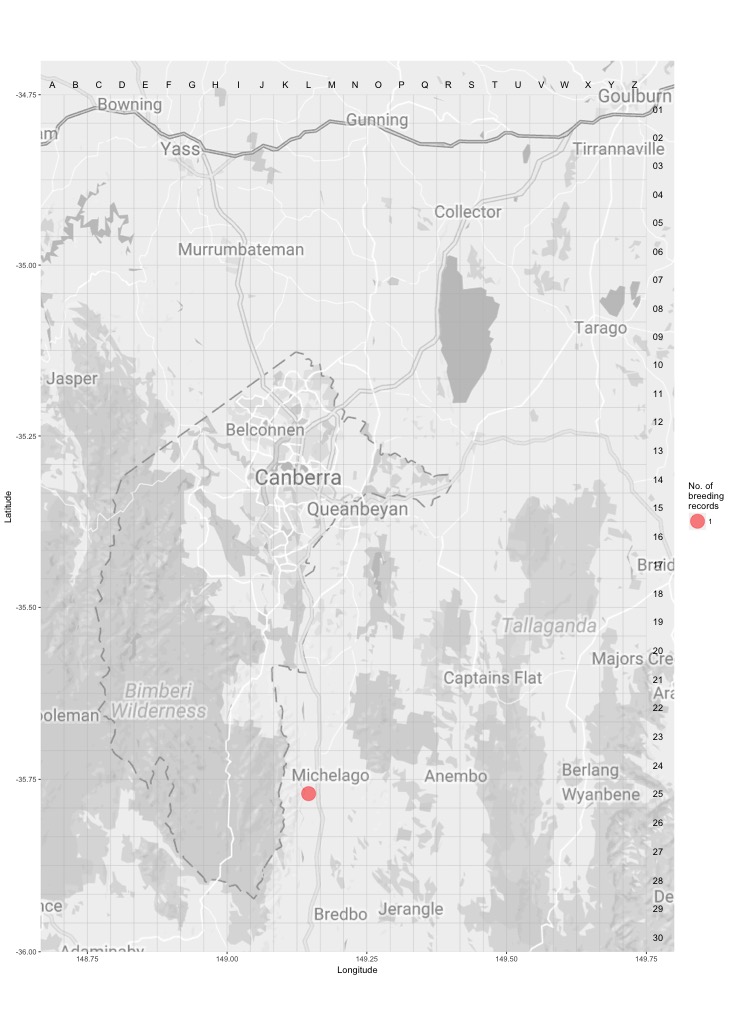
Breeding - all years
This map shows the breeding distribution of the Pallid Cuckoo for all years.
The red circles are the grid cells where breeding activity for Pallid Cuckoo have been reported.
The size of the circle represents the number of reports. 